
Global Burden of Disease (2017)
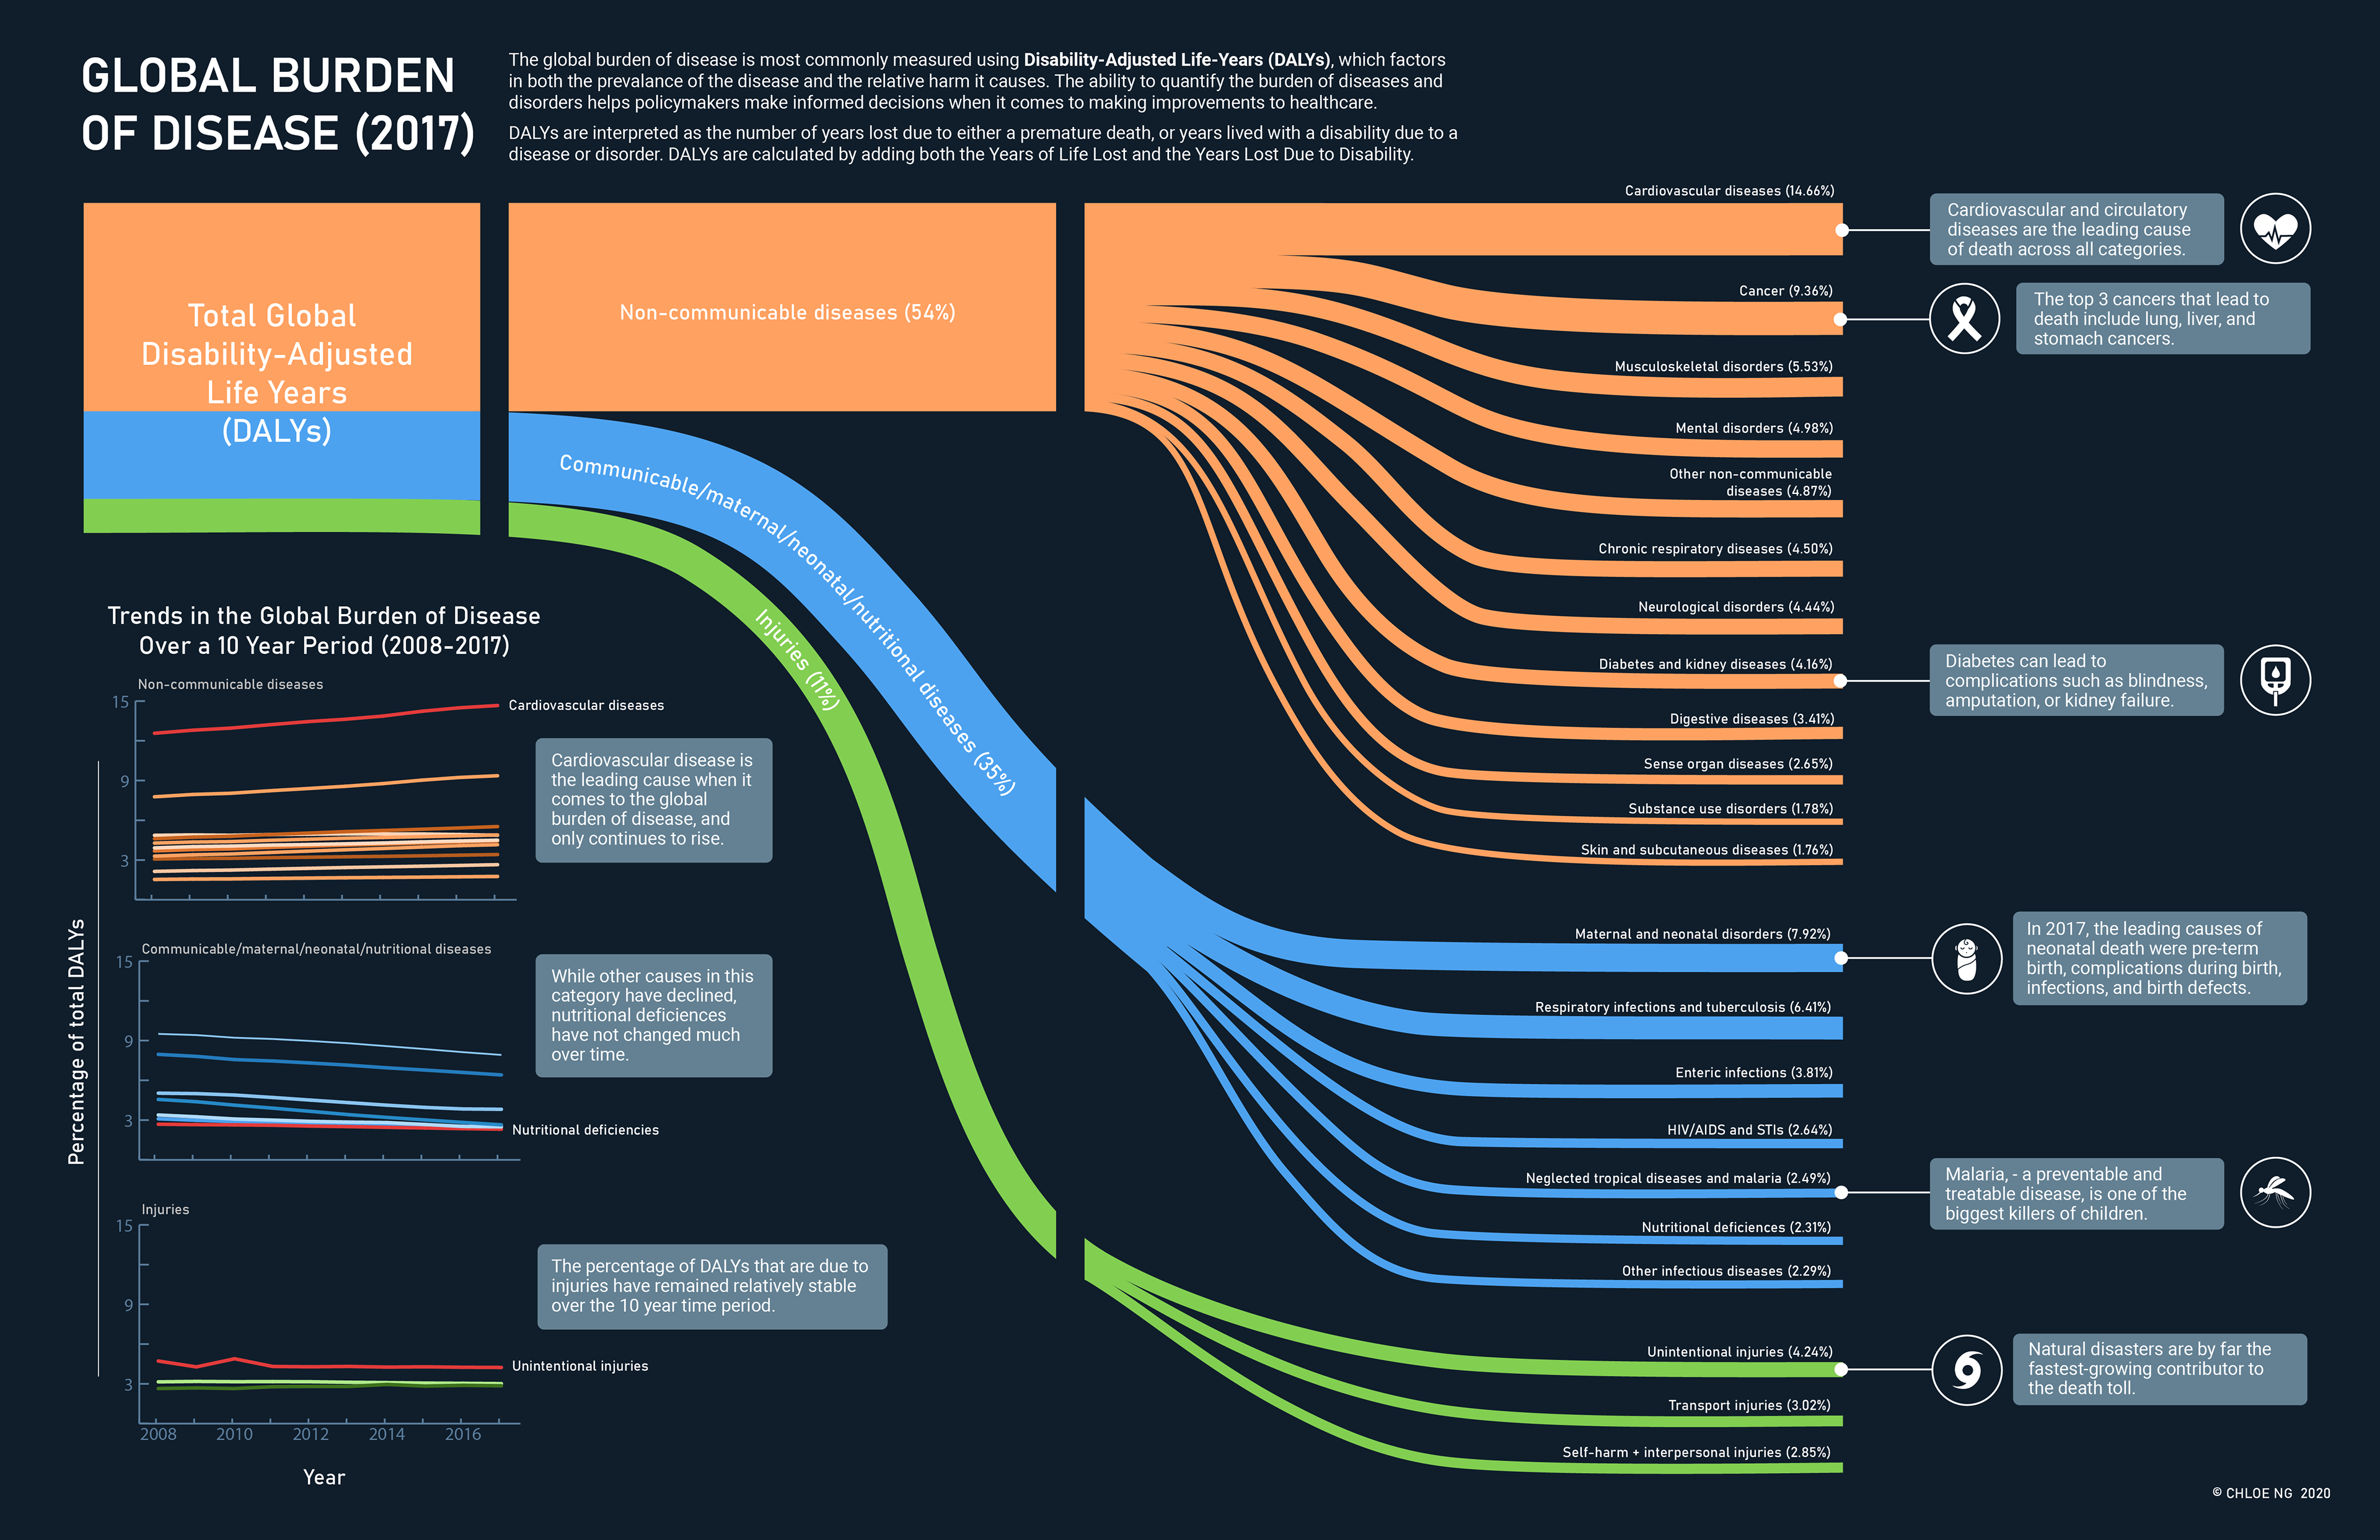
A static data visualization created during my time in the Biomedical Communications program at the University of Toronto. The visualization depicts the Global Burden of Disease in 2017 as measured using Disability-Adjusted Life-Years (DALYs). Annotations are added for particularly interesting facts of note. Trends over a 10 years (2008-2017) are also included to provide context.
Tool: Adobe Illustrator
Data from: https://vizhub.healthdata.org/gbd-results/